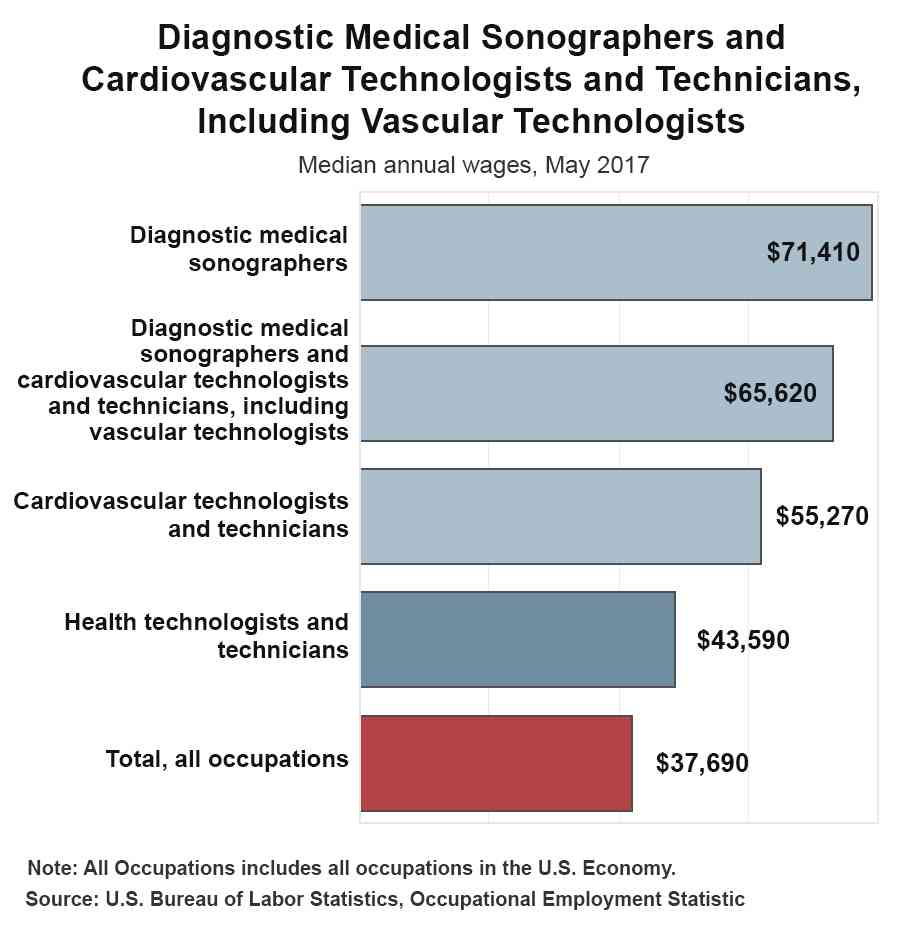
How much can I expect to earn as a diagnostic medical sonographer, cardiovascular technologist or ultrasound technician?
According to the Bureau of Labor Statistics, the median annual wage for cardiovascular technologists and technicians was $60,570 in October 2022. The median wage is the wage at which half the workers in an occupation earned more than that amount, and half earned less. The lowest 10 percent earned less than $29,910, and the highest 10 percent earned more than $101,650.
The median annual wage for diagnostic medical sonographers was $77,740 in May 2021. The lowest 10 percent earned less than $53,790, and the highest 10 percent earned more than $105,340.
Below is the information per state for medical sonographers, ultrasound technicians and cardiovascular technologists.
| State | Lowest Salary | Average Salary | Highest Salary |
|---|---|---|---|
| Alabama (see schools) | $45,860 | $60,550 | $77,030 |
| Alaska (see schools) | $47,880 | $98,140 | $12,767 |
| Arizona (see schools) | $61,300 | $80,330 | $1,01,590 |
| Arkansas (see schools) | $56,090 | $61,840 | $78,340 |
| California (see schools) | $74,460 | $1,01.230 | $1,57.950 |
| Colorado (see schools) | $75,040 | $91,760 | $1,00,870 |
| Connecticut (see schools) | $63,940 | $82,880 | $1,20,240 |
| DC (District of Columbia) (see schools) | $77,740 | $1,01.650 | $1,26.330 |
| Delaware (see schools) | $60,800 | $77,450 | $99,780 |
| Florida (see schools) | $57,820 | $75,040 | $83,310 |
| Georgia (see schools) | $47,970 | $75,040 | $74,550 |
| Hawaii (see schools) | $77,450 | $99,410 | $1,25,950 |
| Idaho (see schools) | $61,310 | $78,480 | $99,380 |
| Illinois (see schools) | $60,820 | $79,810 | $1,00,740 |
| Indiana (see schools) | $56,150 | $74,340 | $95,220 |
| Iowa (see schools) | $60,350 | $76,590 | $95,360 |
| Kansas (see schools) | $59,640 | $77,280 | $98,030 |
| Kentucky (see schools) | $48,720 | $75,000 | $84,940 |
| Louisiana (see schools) | $47,440 | $61,790 | $79,560 |
| Maine (see schools) | $61,200 | $77,630 | $98,780 |
| Maryland (see schools) | $62,980 | $79,810 | $99,820.5 |
| Massachusetts (see schools) | $64,900 | $95,220 | $1,20,250 |
| Michigan (see schools) | $57,510 | $62,620 | $79,360 |
| Minnesota (see schools) | $73,390 | $79,810 | $1,01.650 |
| Mississippi (see schools) | $47,690 | $61,530 | $78,670 |
| Missouri (see schools) | $59,640 | $75,040 | $95,360 |
| Montana (see schools) | $61,790 | $78,670 | $1,00,200 |
| Nebraska (see schools) | $59,900 | $76,710 | $81,630 |
| Nevada (see schools) | $62,390 | $78,610 | $98,150 |
| New Hampshire (see schools) | $61,340 | $80,640 | $1,00,770 |
| New Jersey (see schools) | $61,510 | $79,810 | $1,01,650 |
| New Mexico (see schools) | $60,500 | $78,340 | $98,030 |
| New York (see schools) | $62,390 | $79,810 | $1,01,650 |
| North Carolina (see schools) | $58,150 | $75,000 | $95,110 |
| North Dakota (see schools) | $59,910 | $74,870 | $96,000 |
| Ohio (see schools) | $59,640 | $75,000 | $94,690 |
| Oklahoma (see schools) | $48,400 | $76,730 | $94,690 |
| Oregon (see schools) | $76,730 | $98,030 | $1,22,610 |
| Pennsylvania (see schools) | $55,530 | $73,850 | $96,140 |
| Rhode Island (see schools) | $63,760 | $95,360.5 | $1,20,240 |
| South Carolina (see schools) | $50,300 | $74,930 | $88,430 |
| South Dakota(see schools) | $37,550 | $61,790 | $78,670 |
| Tennessee(see schools) | $48,920 | $65,840 | $94,690 |
| Texas(see schools) | $50,510 | $77,030 | $98,730 |
| Utah(see schools) | $59,640 | $78,670 | $1,00,870 |
| Vermont(see schools) | $60,550 | $79,360 | $98,030 |
| Virginia(see schools) | $59,640 | $77,450 | $1,00,870 |
| Washington(see schools) | $77,030 | $98,470 | $1,25.130 |
| West Virginia(see schools) | $48,590 | $62,160 | $79,360 |
| Wisconsin(see schools) | $75,000 | $94,690 | $1,01,650 |
| Wyoming(see schools) | $62,700 | $78,670 | $98,140 |
| Puerto Rico(see schools) | $17,940 | $28,600 | $36,700 |
In May 2017, the median annual wages for cardiovascular technologists and technicians in the top industries in which they worked were as follows :
| Outpatient care centers | $63,700 |
| Offices of physicians | $58,310 |
| Hospitals; state,local and private | $54,660 |
| Medical and diagnostic laboratories | $48,920 |
In May 2017, the median annual wages for diagnostic medical sonographers in the top industries in which they worked were as follows :
| Outpatient care centers | $81,200 |
| Hospitals; state, local, and private | $71,740 |
| Offices of physicians | $69,890 |
| Medical and diagnostic laboratories | $69,690 |